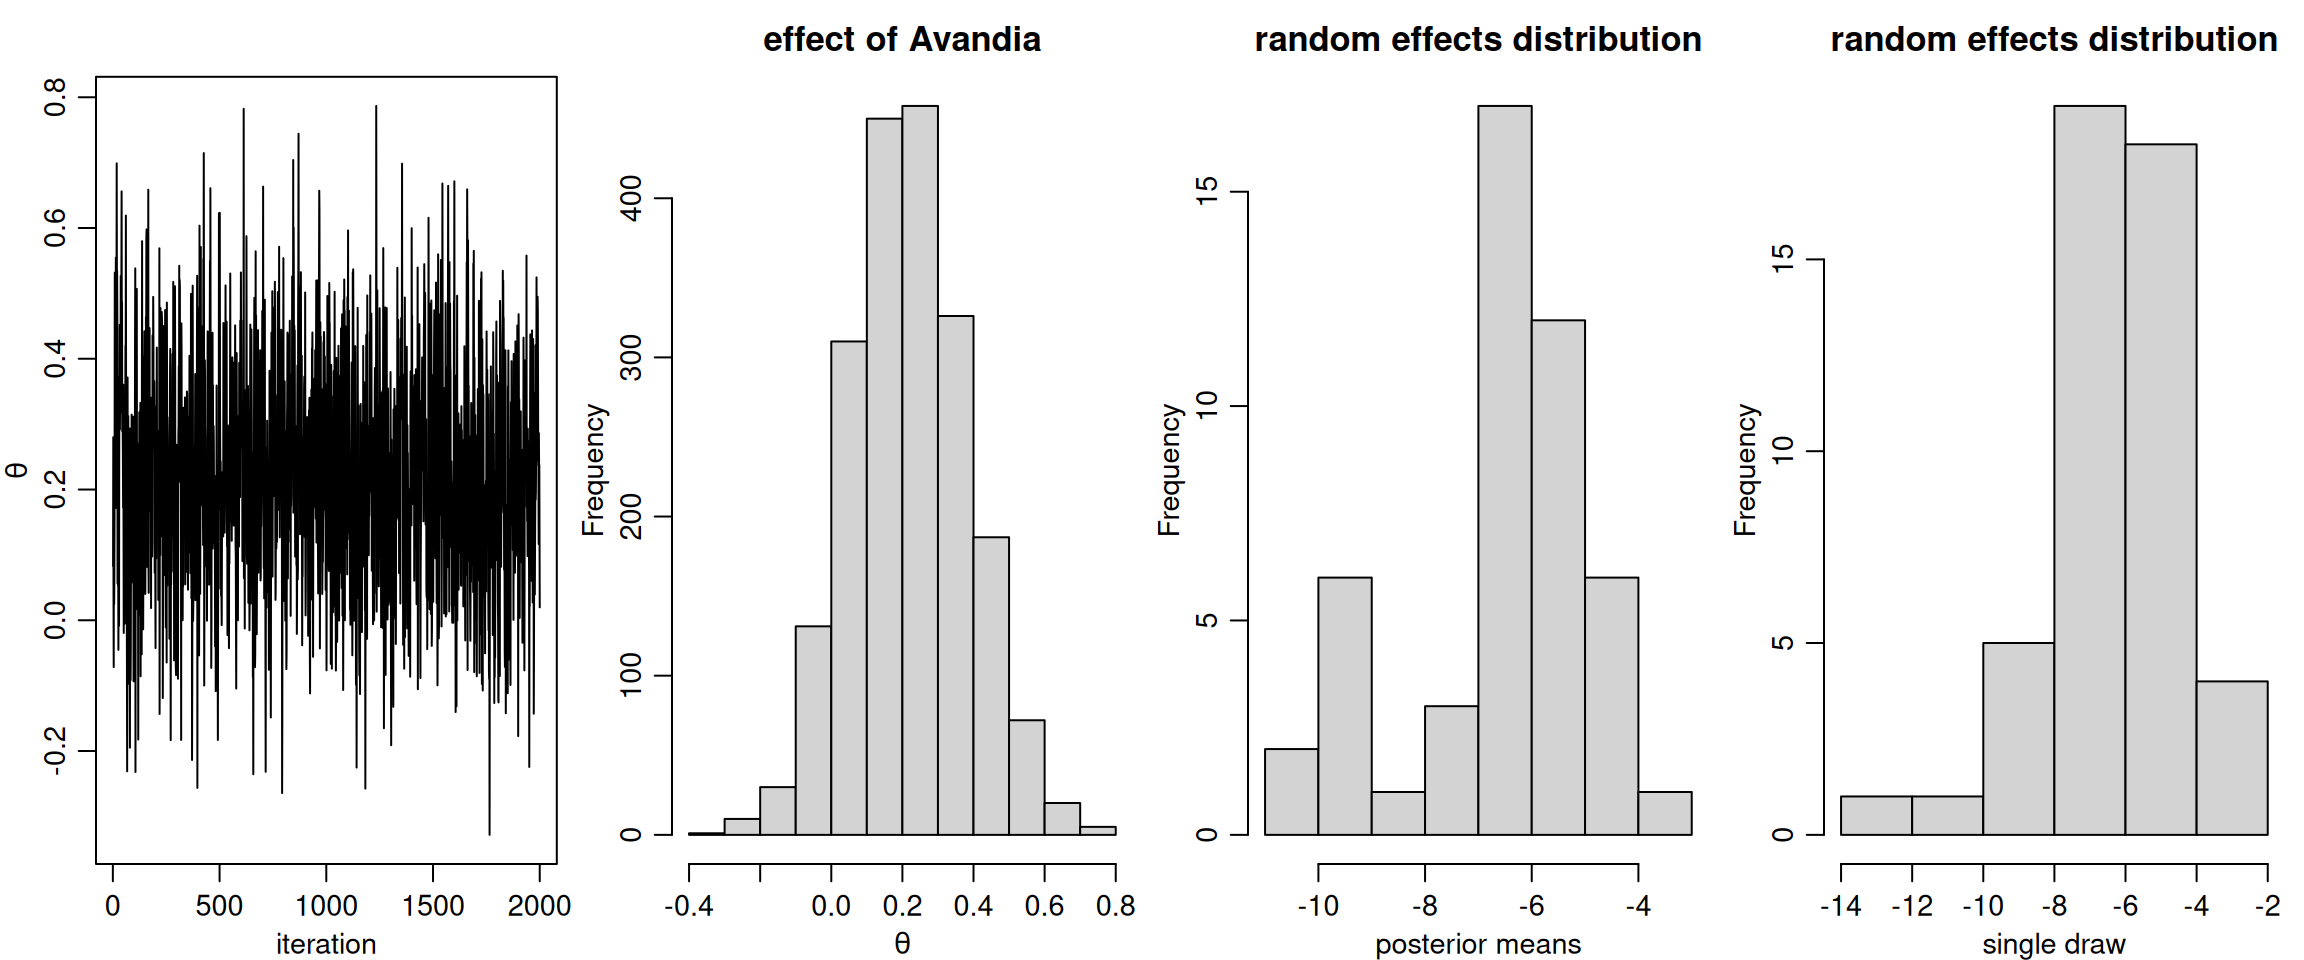
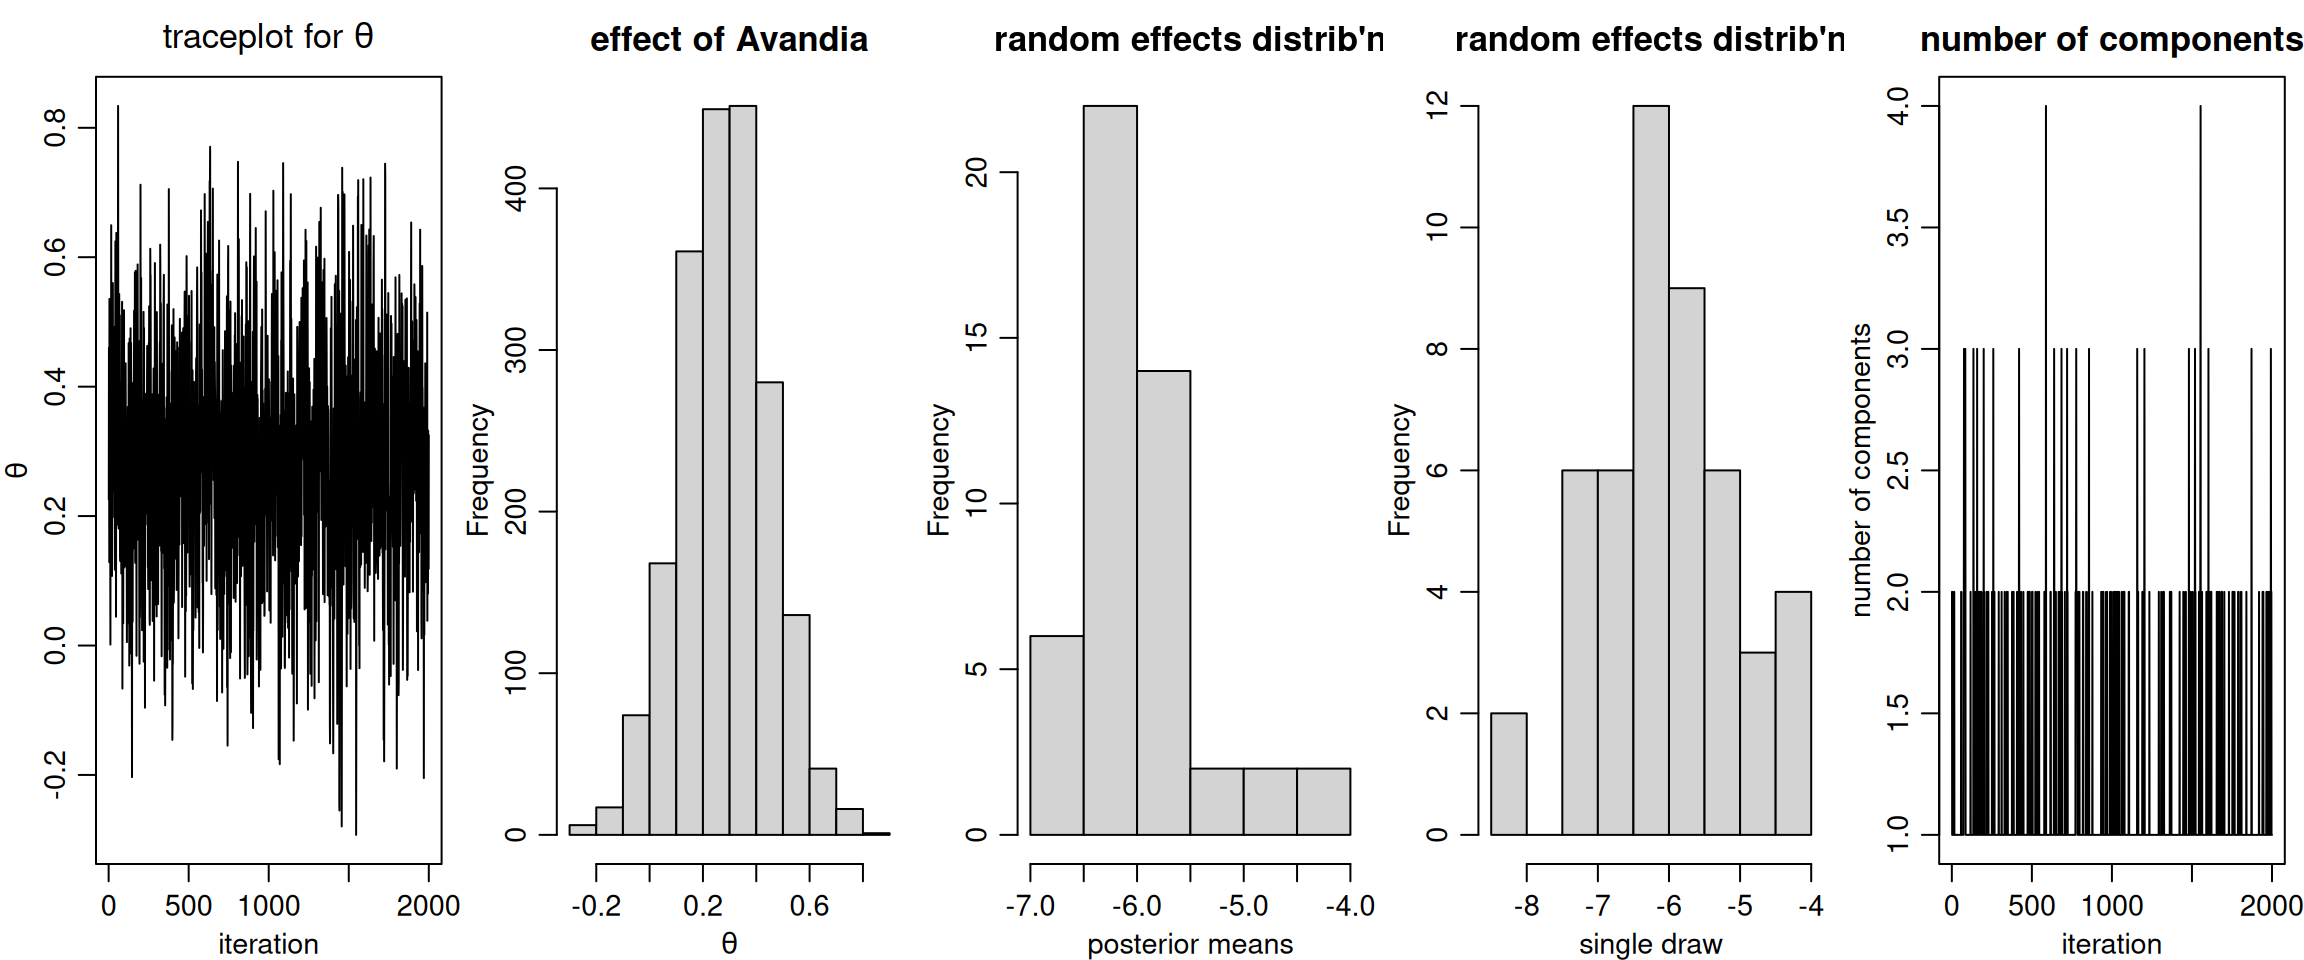
gammaCols <- grep('gamma', colnames(samplesBNP))
gammaMn <- colMeans(samplesBNP[ , gammaCols])
xiCols <- grep('xi', colnames(samplesBNP))

par(mfrow = c(1,5), cex = 0.9, mgp = c(1.8,.7,0), mai = c(.5,.5,.4,.1))
ts.plot(samplesBNP[ , 'theta'], xlab = 'iteration', ylab = expression(theta),
   main = expression(paste('traceplot for ', theta)))
hist(samplesBNP[ , 'theta'], xlab = expression(theta), main = 'effect of Avandia')
hist(gammaMn, xlab = 'posterior means',
              main = "random effects distrib'n")
hist(samplesBNP[1000, gammaCols], xlab = 'single draw',
                   main = "random effects distrib'n")

# How many mixture components are inferred?
xiRes <- samplesBNP[ , xiCols]
nGrps <- apply(xiRes, 1, function(x) length(unique(x)))
ts.plot(nGrps, xlab = 'iteration', ylab = 'number of components',
   main = 'number of components')